
武汉大学课题组2025年4月在《Journal of Rock Mechanics and Geotechnical Engineering》期刊发表了题为“Monotonic triaxial testing and hypoplastic modelling of calcareous sand: A focus on particle breakage and initial relative density”(钙质砂的单调三轴试验与低塑性建模颗粒破碎与初始相对密度的耦合效应)基于广义剪应变的各向异性固结饱和砂土超静孔压发展模型”的学术论文。本研究采用GDS自动三轴仪试验系统,开展单调三轴与亚塑性建模,聚焦颗粒破碎与初始相对密度对钙质砂应力-应变-临界状态的耦合影响,提出统一破碎演化方程,构建可预测级配、强度与变形的新型亚塑性模型,为岛礁与离岸工程填筑体抗震变形分析提供本构基础。

https://doi.org/10.1016/j.jrmge.2025.04.018
*论文版权归原作者和出版方所有,本文仅为学习交流。
以下是对这项成果的简要介绍:
论文摘要
钙质砂的应力–应变特性受颗粒破碎(B)与初始相对密度(Dri)显著影响,但现有本构模型极少同时考虑二者的耦合作用。为填补这一空白,本文针对不同Dri和应力路径的钙质砂开展系列三轴试验,系统研究颗粒破碎与临界状态行为。
主要发现如下:(1)当应力比(η)恒定时,B随平均有效应力(p')呈双曲线关系;给定p'下,B随η线性增大;(2)临界状态线(CSL)随Dri增大而下移,而临界状态摩擦角(φcs)随B增大而减小。基于上述结果,提出统一的颗粒破碎演化模型,用以量化不同加载条件下钙质砂的破碎程度。将该模型与正常固结线(NCL)及CSL方程耦合,成功再现随B增大、NCL与CSL斜率增大的现象,并定量评估B对φcs的影响。最后,在临界状态土力学与亚塑性理论框架内,建立了同时引入B与Dri的亚塑性模型;该模型在不同初始相对密度、应力路径及排水条件下的模拟结果与试验数据高度吻合,验证了其可靠性。
试验设备
本研究使用了GDS自动三轴仪GDSTAS等设备。

实验方法及相关图表
*图表为论文截图,版权归论文原作者和出版方所有,本文仅为学习交流。

Fig. 1. Physical properties of calcareous sand: (a) SEM image; and (b) Grain size distribution (GSD) curve of calcareous sand.


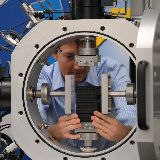
Fig. 2. Test schematic and apparatus: (a) Test schematic; and (b) GDS triaxial automated system.

Fig. 3. Effect of initial densities on the triaxial test results of calcareous sand: (a-b) CTC test, p=200 kPa; (c-d) TC test, p=200 kPa; (e-f) RTC test, p=200 kPa; (g-h) CU test, p=200 kPa; (i-j) CTC test, p=800 kPa; (k-l) TC test, p=800 kPa; (m-n) RTC test, p=800 kPa; and (o-p) CU test, p=800 kPa

Fig. 4. Variation in GSD curves of calcareous sand and relationship between B with p′ and η: (a-b) Effect of D; (c-d) Effect of p; and (e-f) Effect of loading path.

Fig. 5. Relationship between B with p' and η: (a) B- log p' relation; and (b) Determination of ω and k (Solid colourful lines represent simulation results by Eq. (8))

Fig. 6. Stress ratio of calcareous sand sheared to maximum axial strain: (a) CTC test; (b) TC test; (c) RTC test; and (d) CU test.

Fig. 7. Comparison of B-p' relations with different test results: (a) Dogs Bay sand; (b) Angular granite (PL: Proportional loading); and (c) Decomposed granite.

Fig. 8. Predicted and measured NCLs of calcareous sand with various initial densities. (a) Predicted versus experimental test results; (b) Influence of k (Eq. (36)); and (c) Influence of k (Eq. (36)).

Fig. 9. Predicted and measured CSLs of calcareous sand with various initial densities: (a) D=0.1; (b) D =0.3; (c) D =0.6; and (d) D =0.9.

Fig. 10. Schematic of the effect of particle breakage on the location of CSL in e-logp' plane

Fig. 11. Influence of parameter χ and β on predicted results: (a) Effect of χ (Eq. (44)); and (b) Effect of β (Eq. (44)).

Fig. 12. Relationship between critical friction angle φ with particle breakage B of calcareous sand: (a) Experimental data; and (b) Effect of χ on predicted M (Eq. (48)).

Fig. 13. Influence of breakage evolution parameters on model prediction results in drained triaxial test: (a-b) Effect of ω; (c-d) Effect of k; and (e-f) Effect of p.

Fig. 14. Influence of initial density effect parameters on model prediction results in drained triaxial test: (a-b) Effect of D; (c-d) Effect of k; and (e-f) Effect of χ.

Fig. 15. Influence of breakage effect parameters on model prediction results in drained triaxial test: (a-b) Effect of k; (c-d) Effect of β; and (e-f) Effect of χB.

Fig. 16. Comparison between model predictions with CTC tests results of calcareous sand at different D: (a-b) D =0.1; (c-d) D =0.3; (e-f) D =0.6; and (g-h) D =0.9.

Fig. 17. Comparison between model predictions with CU tests results of calcareous sand at different Dri: (a-b) Dri =0.1; (c-d) Dri =0.3; (e-f) Dri =0.6; and (g-h) Dri =0.9.

Fig. 18. Comparison between model predictions with TC tests results of calcareous sand at different D: (a-b) D=0.1; (c-d) D =0.3; (e-f) D =0.6; and (g-h) D=0.9.

Fig. 19. Comparison between model predictions with RTC tests results of calcareous sand at different D: (a-b) D =0.1; (c-d) D =0.3; (e-f) D=0.6; and (g-h) D =0.9.

Fig. 20. Comparison of the predicted and measured values of B

Fig. 21. Change in GSD of calcareous sand with D=0.1:(a-b) CTC test; (c-d) TC test; (e-f) RTC test; and (g-h) CU test.

Fig. 22 Comparison between model predictions with drained triaxial tests results of Silica sand at different D: (a-b) D =0.30; (c-d) D =0.60; and (e-f) D=0.90.
研究结论
现有本构模型未能充分考虑颗粒破碎(B)与初始相对密度(D)对钙质砂的耦合影响。为此,本文开展了系列三轴压缩试验,涵盖不同D、应力路径与排水条件。基于试验结果,提出了新的破碎演化模型,并修正了正常固结线(NCL)与临界状态线(CSL)方程,以同时纳入B与D的联合作用。随后,将这些公式嵌入亚塑性框架,建立了改进的亚塑性本构模型。主要结论如下:
(1)三轴试验表明,B与D对强度与变形具有显著且相互依赖的影响。低围压下B较小,D起主导作用;随围压增大,B增加,D的影响减弱。
(2)颗粒破碎主要受应力比η与平均有效应力p′控制。η恒定时,B随p′增大而升高;p′恒定时,B与η成正比。提出的双曲线破碎演化模型仅需3个易标定参数,即可描述不同应力路径、D与围压下的破碎行为。
(3)新NCL与CSL方程可准确反映随B增大而陡化、随D增大而下移的规律;临界状态摩擦角φ随B线性降低。
(4)将破碎演化模型与修正NCL、CSL方程融入亚塑性框架,建立了可同时考虑颗粒破碎与初始密度的扩展亚塑性模型,可精确预测级配演化、强度与变形。
尽管模型预测性能良好,但验证仅限于等向固结与单调加载。实际岛礁与离岸工程常面临各向异性应力与风浪循环荷载,后续研究将拓展模型至这些复杂工况,提升其工程适用性。
备注:论文摘要及结论等为论文原文的中文译文,仅供快速参考;若遇语义或技术细节歧义,请以英文原文为准。完整研究内容、参数取值及验证数据请查阅原文。


热门跟贴